Humanity Calendar
How we Discover
Resources and Analysis.
25 per cent of NHS staff are from ethnic minority backgrounds.
20 per cent of staff are non-British.
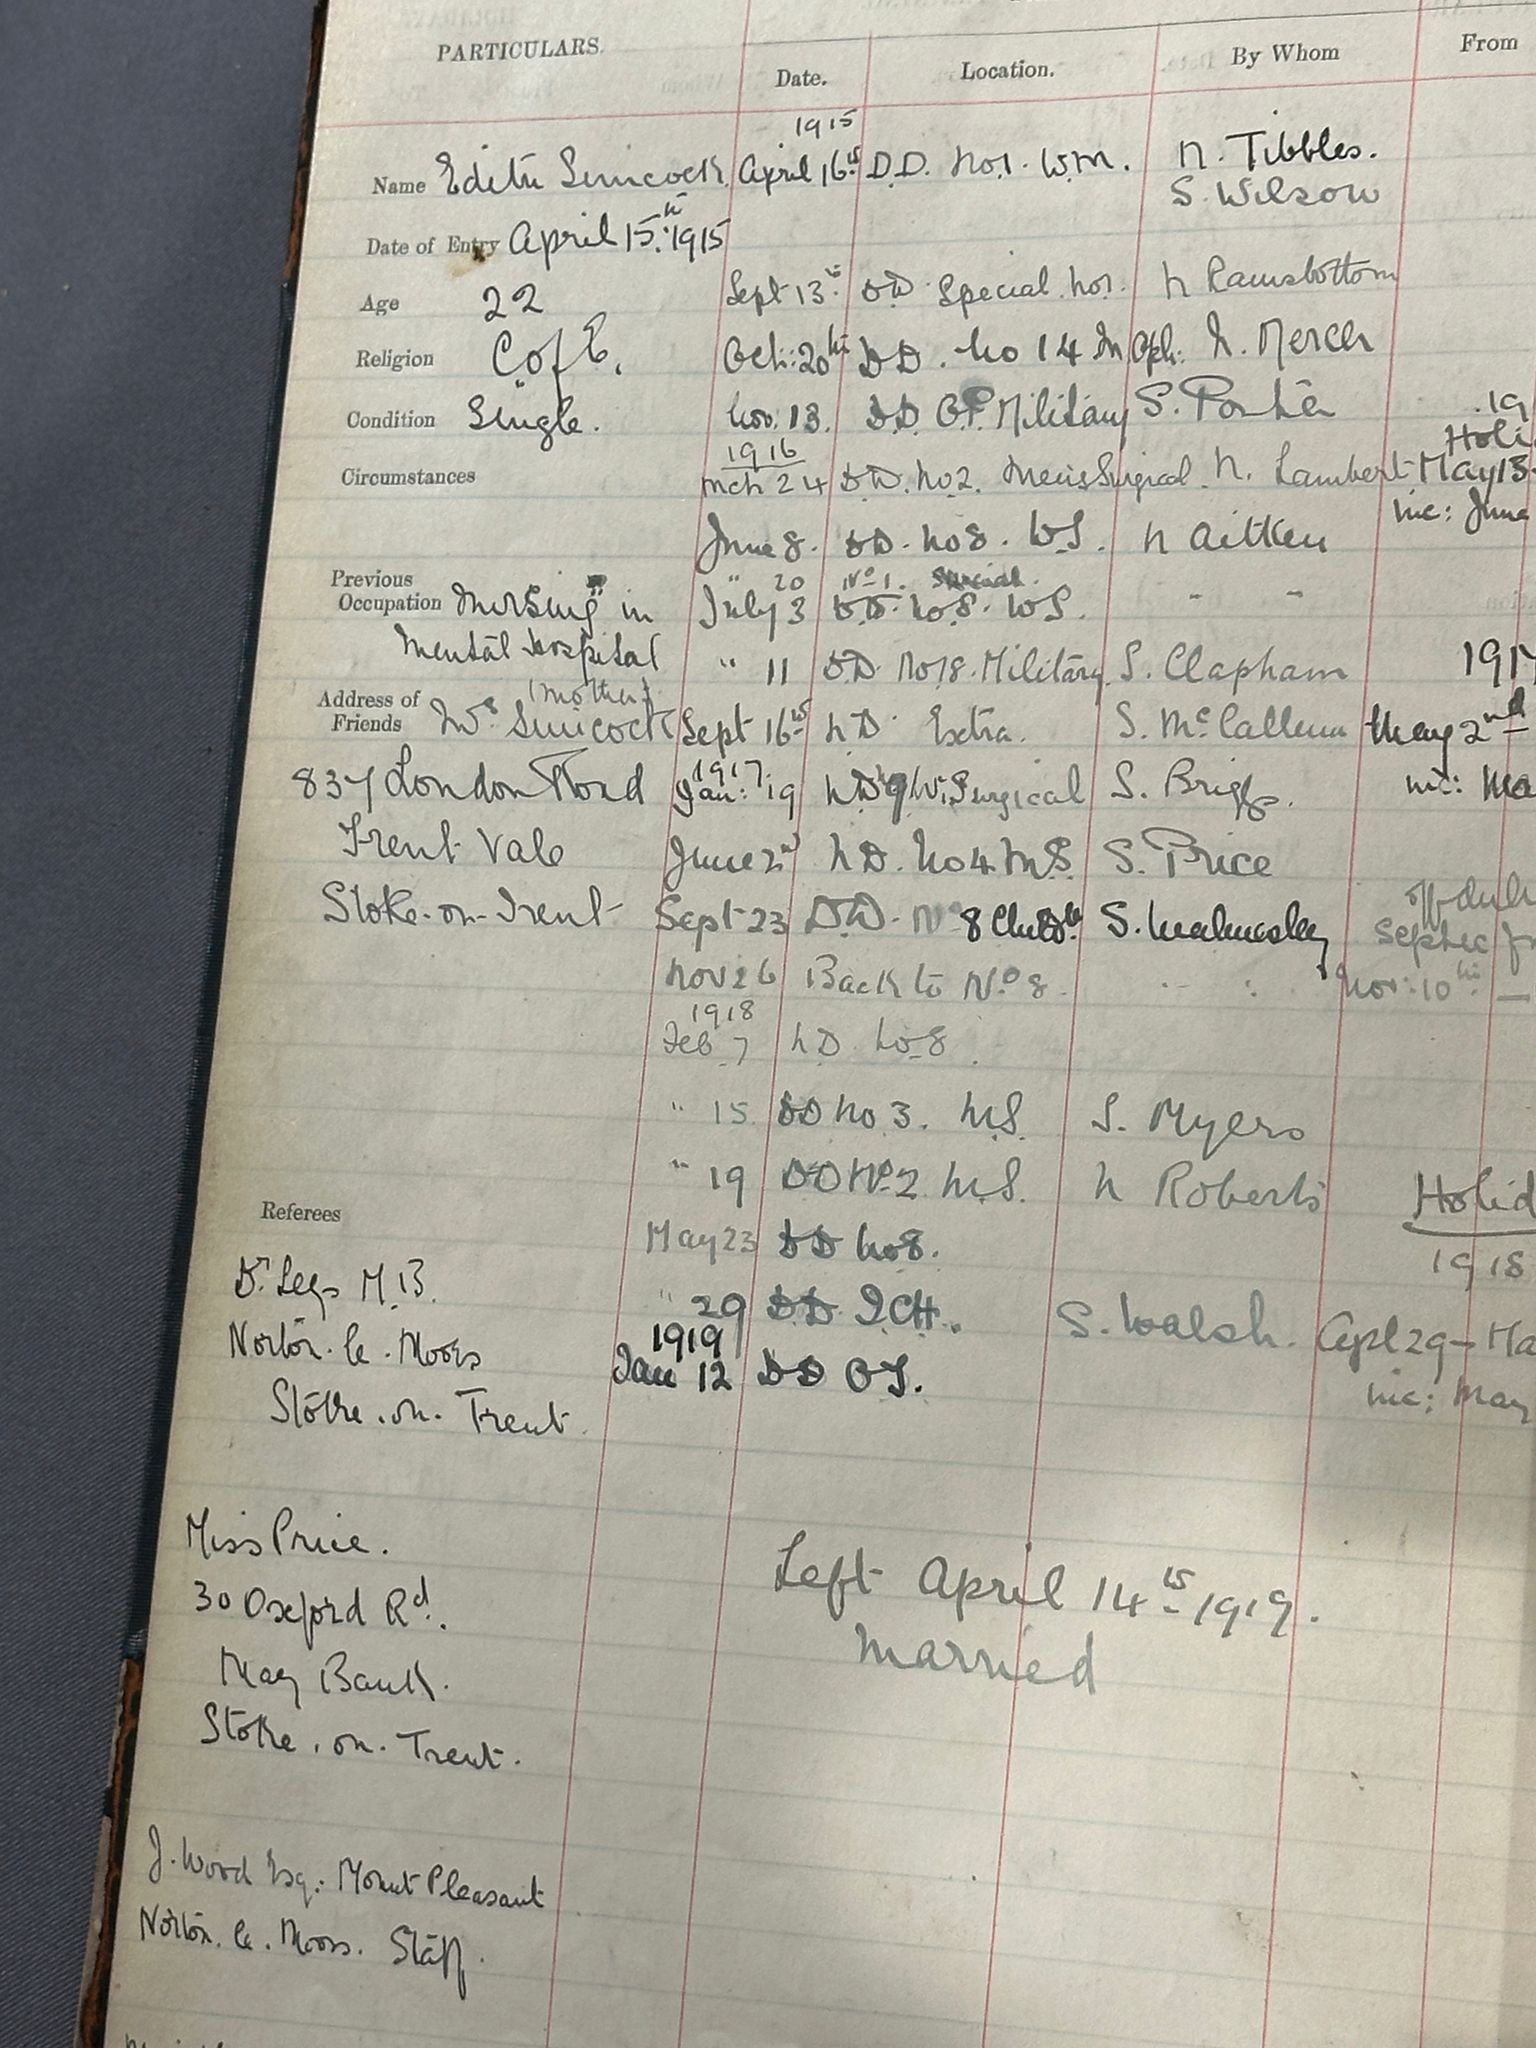
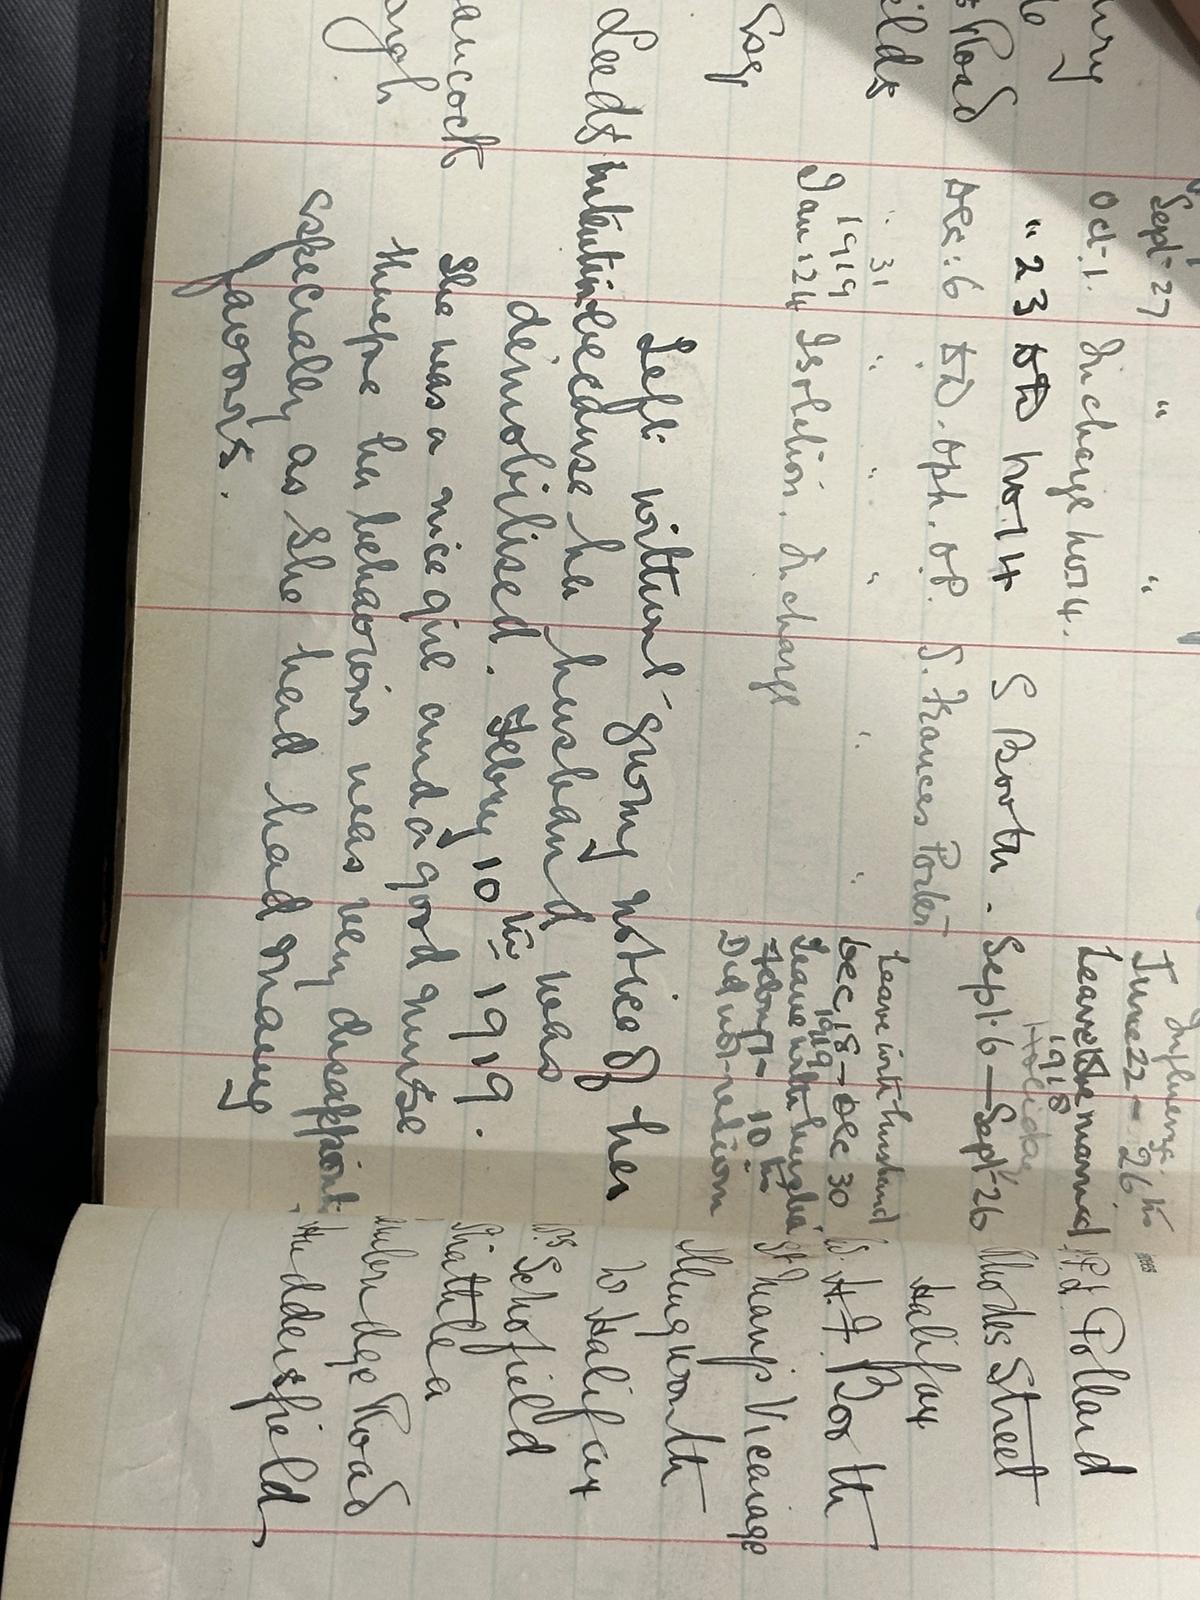
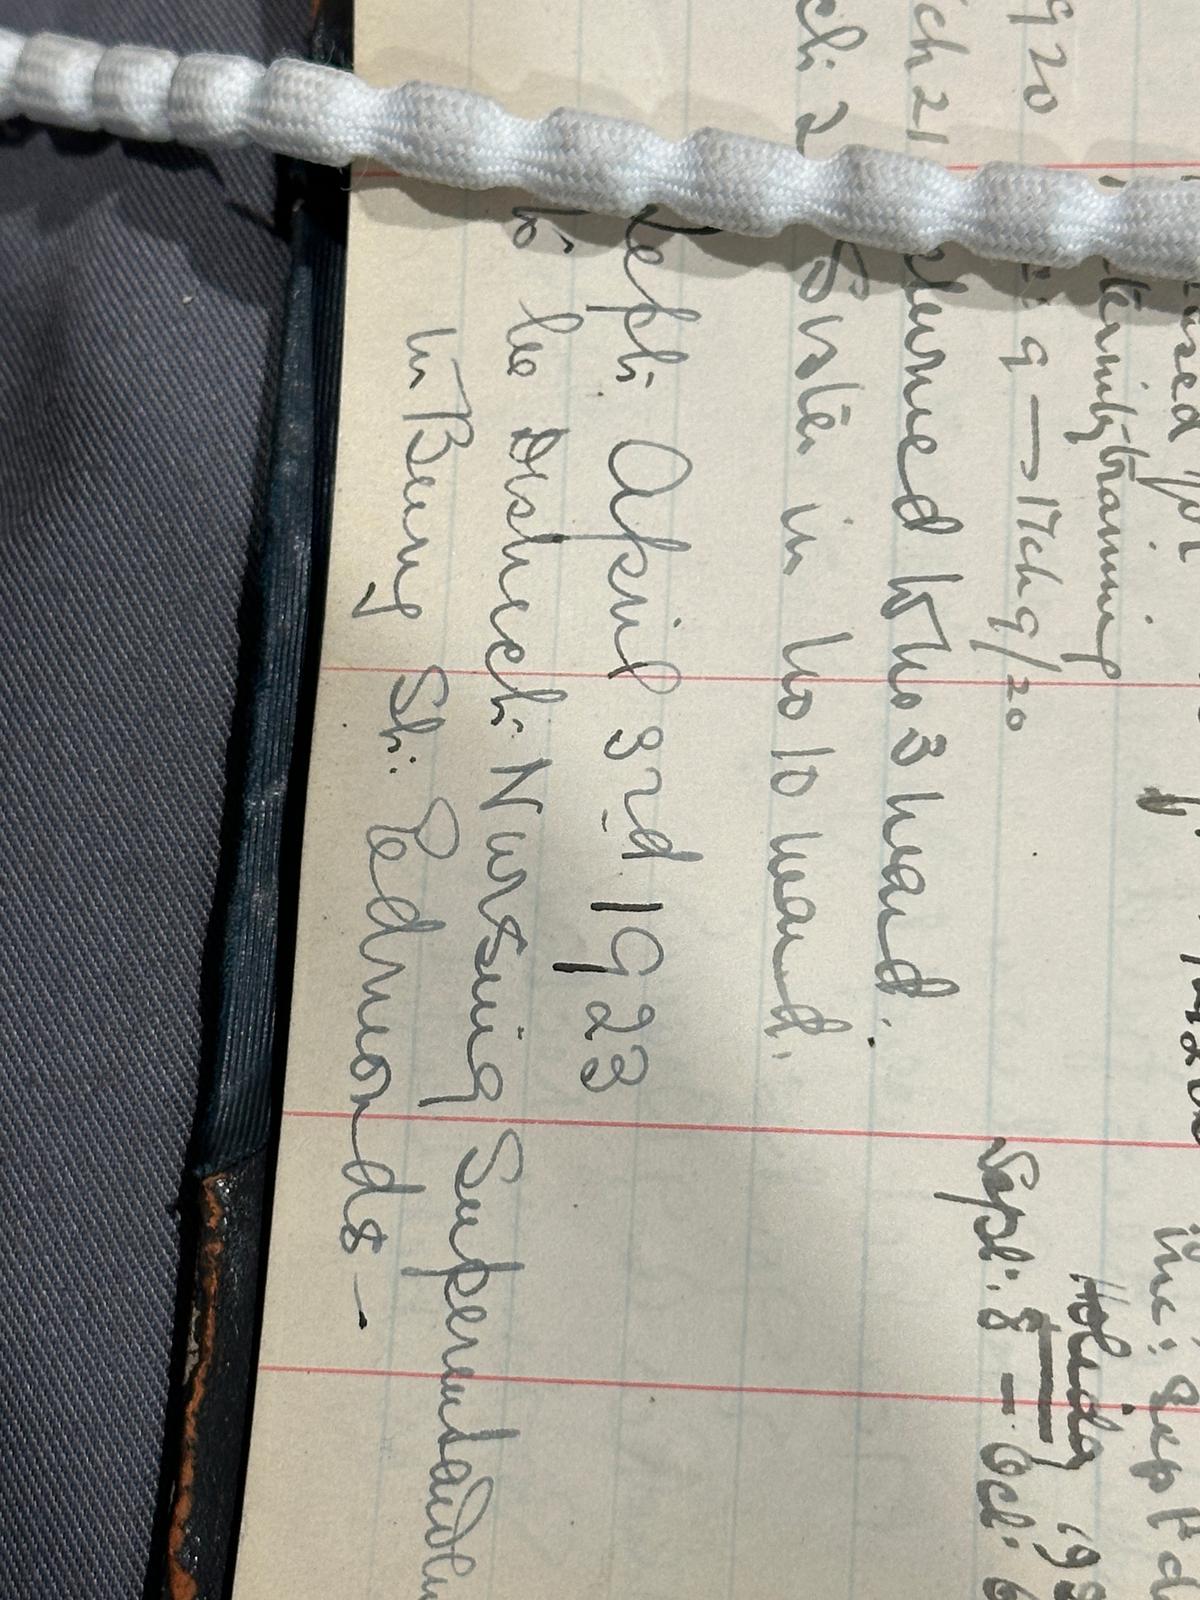
According to statistics (Gregory, 2024), 'By 2024, around 20.4 per cent of NHS staff will be non-UK nationals, demonstrating the importance of international staff in the UK healthcare system.' When we link historical archives to the context of the times, due to the impact of the First World War, the demands of the war led to an increase in occupational demand, so nurse training became an option for young native British women. It is important to note that information on the race and nationality of nurses is missing from the statistics on nursing staff in the Nurses' Register from 1910 to 1972. Moreover, according to the 2024 NHS report, it can be seen that the proportion of non-British nationals has risen to an all-time high, meaning that nursing is no longer just a career choice but is also becoming an important gateway to becoming a labour force migrant. At the same time, statistics on the nursing workforce show that the ethnicity, nationality, salary and grade of the current nursing workforce are all highly quantifiable, and this information is facilitated by a very high level of numerical visualisation.
In the stacked graph shown, it is achieved through the data found under ethnicity on NHS. According to the dataset, in 2022, over 1.3 million people were employed by the NHS. Out of NHS staff whose ethnicity was known, 74.3% were white - by comparison, 80.7% of the working age population in England was white. Asian staff made up 12.5& of the NHS workforce, and 10.1% of the working age population. Black staff made up 7.4% with 4.4% of the working age population. During the period of 2009 to 2022. The percentage of NHS white staff went down from 84.1% to 74.3% In the stacked graph, you could see the detailed proportion of each ethinicity.
When we compare the data above to the Nurse Registration from 1910 to 1972, the reality that there are virtually no records of the racial content of nurses in the files demonstrates how the ‘silent history’ is reflected today. And uing the existing data provided by the NHS staff from overseas, this visual map highlights the reliance of the NHS on international labor, especially from the former colonies. It explores the regional variations in ethnic minority representation within the UK, showcasing how diversity is unevenly distributed across the NHS. The stacked graph shown achieves it through the data found under ethnicity on NHS. According to the dataset, in 2022, over 1.3 million people were employed by the NHS. Out of NHS staff whose ethnicity was known, 74.3% were white - by comparison, 80.7% of the working-age population in England was white. Asian staff comprised 12.5% of the NHS workforce and 10.1% of the working-age population. Black staff made up 7.4% with 4.4% of the working age population, from 2009 to 2022. The number of NHS white staff decreased from 84.1% to 74.3%. In the stacked graph, you can see the detailed proportion of each ethnicity.>
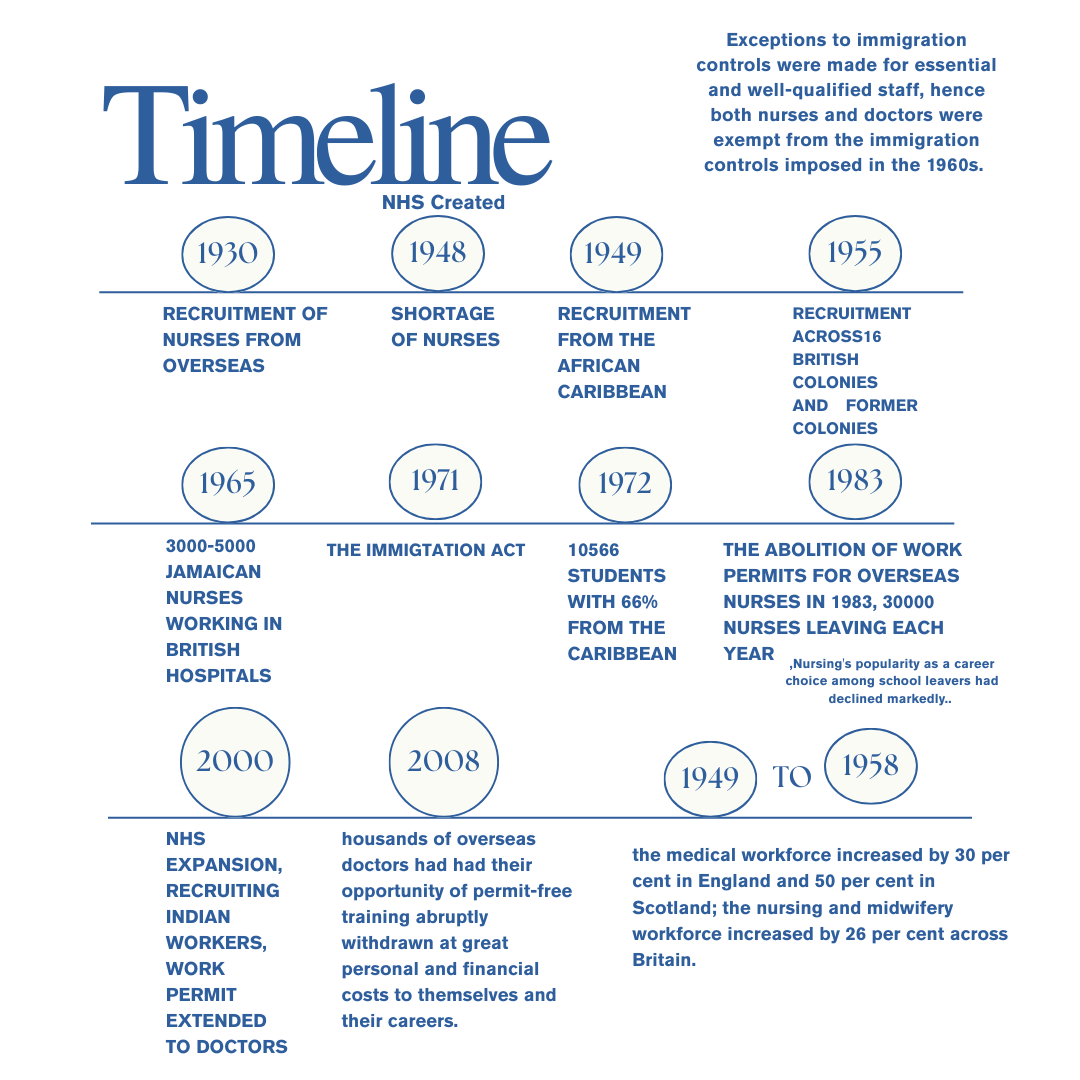
This chart reveals not only the "ethnic diversity" of the workforce but also visual evidence of the structural dependence of the NHS on international nursing talent. According to The Guardian (2024), non-British staff already make up a record 20.4 per cent of the NHS workforce as of 2024. Since the 1940s, the NHS has systematically imported female nurses from the Caribbean, South Asian and African countries to alleviate the shortage of native labour. This historic immigration policy has created a map of the "colonial legacy" of the racial structure of the nursing profession in the UK - the intersection of the "racialisation" and "gendering" of nursing positions. "Gendered structure of nursing positions.
Immigration policy has played a dual role in this process, on the one hand providing a career pathway into British society for large numbers of women of colour, but on the other hand, perpetuating the confinement of these women to low-paying "caring" roles such as nursing, creating the stereotypical label of "immigrant women = caring workforce" and "migrant women = caring labour". "This has led to the stereotypical labelling of "immigrant women = care labour".
Although the proportion of BME groups continues to rise, does this mean racial justice and equality have been achieved?
According to the NHS Workforce Race Equality Standard 2018 report, there is a continuum of structural oppression between the past and the present: the majority of expatriate nurses are concentrated in entry-level roles; promotion is brutal and under-represented at managerial level; and staff of colour are more likely to experience discrimination, stress and more fluid contractual arrangements.
In addition, the UK's policy of "skilled migration" and international recruitment trends (e.g. NHS recruitment routes in India and Nigeria), while addressing short-term workforce shortages, have exacerbated the "chain of global inequality in nursing": developing countries train and developed countries pay well to absorb nursing talent. Developing countries train nursing talent, and developed countries absorb it at high salaries, creating a so-called "brain drain".
Looking at historical records (1910-1972 Nurse Training Registration), we can see that at that time, the ethnicity and nationality of nurses were not recorded in the records, nor were they considered part of the nursing profession. Today, this "invisibility" is translated into precise statistics on identity data, but also reveals that the structural stratification of the nursing profession along the dimensions of "ethnicity" and "nationality" still exists.
Thus, the graphs in our study provide a basis for visualisation and a gateway to understanding the continuation of "ethnicised-migrant" structures and institutional inequalities in the nursing profession. It prompts us to ask whether the nursing profession is truly decolonised and systematically equitable in the face of the prevalence of digitalisation and discourses of "diversity".
Figures to September 2023 show that the proportion of white staff in the NHS workforce has fallen to 70.2 per cent, while the proportion of BME (Black and Minority Ethnic) staff is at an all-time high of 29.8 per cent. This trend has increased year on year since 2009 and reflects the reality of the process of "multi-ethnicisation" in nursing.
Of the different ethnic groups:
Asian employees, at 12.4%, have the highest proportion of any BME group;
Black employees, at 7.5%, have grown steadily in recent years;
Mixed employees, at 2.4%, and the "Other Ethnicity" category, at 1.6%;
Although the combined total of the BME groups is nearly 30%, the proportion of BME employees in nursing has grown steadily over the years. Although the BME group totals nearly 30 per cent, it is still far less represented in senior positions than white employees. Increasing ethnic diversity has failed to fully break the "invisible glass ceiling" in the NHS.
In contrast to the single white British female-dominated occupational structure of the historical archive (Nurses' Register 1910-1972), the contemporary nursing profession shows a significant ethnic transition. Behind this transformation is a strong link to the Commonwealth migration wave since the 1950s, global nurse shortage policies and the NHS's institutional dependence on international nurses. While the growth of the BME workforce certainly signals the healthcare system's acceptance of a multi-ethnic workforce, it is still constrained by issues of racial prejudice, barriers to promotion and institutional discrimination.
According to the NHS Workforce Race Equality Standard (WRES) report, BME employees are generally less satisfied than white employees when applying for promotions, professional development, and respect in the workplace. Around 15 per cent of BME staff report experiencing racial discrimination at work, revealing the underlying inequalities that lie beneath the "superficial diversity" of the nursing profession.
Therefore, The graph visualises the structure of racial proportions and provides important evidence for analysing institutional racial inequalities in the nursing profession. It reminds us that behind the numbers, there is still a need to uncover the institutional constraints and historical causes beneath the statistics.
In a professional system that was once predominantly single-sex and single-race, despite the introduction of WRES (Workforce Race Equality Standards) in the NHS, what does this "diversity" mean? This is a question worth pondering. There is still a long way to go in eliminating deep structural inequalities for historical reasons and those that have developed over time in the system.